3 min read

What K-12 Districts Spend on Device Repair: In-House vs. Outsourced

What K-12 Districts Spend on Device Repair: In-House vs. Outsourced

When a Chromebook screen cracks or a keyboard stops responding, the default instinct for many districts is to handle it internally.

The reasoning makes sense on the surface: you already have staff, you control the timeline, and you avoid paying a vendor margin. But when you model out the total cost of ownership for in-house repair at scale, the math often tells a different story.

This post breaks down what it actually costs to run repair operations in-house versus outsourcing them, including the costs that rarely appear in a budget proposal but reliably show up in year-end spending.

What "In-House Repair" Actually Costs

Most districts calculate in-house repair costs by looking at parts and maybe one technician's time. That's the wrong starting point.

The full cost of in-house repair includes:

  • Technician labor. A dedicated repair tech in education typically runs $45,000–$65,000 annually before benefits. If repair work is distributed across generalist IT staff, you're drawing time away from network maintenance, help desk tickets, and everything else those staff members own.
  • Parts sourcing and inventory. Keeping a stocked inventory of screens, keyboards, batteries, and hinges for multiple device models ties up capital in parts that may or may not get used. Obsolete parts inventory is a real and often invisible budget drain.
  • Tools and workspace. Proper repair equipment, a staging area, and storage space are fixed costs that don't scale down when repair volume drops.
  • Training. Device models change. Staff who repaired last year's Chromebook fleet may have limited familiarity with newer hardware. Ongoing training adds time and cost.
  • Downtime while devices wait. When a tech has a backlog, devices sit. That means longer loaner fleet cycles and more devices out of student hands.

The staffing piece is where most districts underestimate in-house costs significantly. According to a 2024 survey of K-12 tech leaders, 61 percent cited staff shortages as a top concern, with 44 percent saying they won't be able to sustain their current staffing level over the next three years. When repair volume competes with higher-priority IT functions for that constrained staff capacity, something gives, and it's usually turnaround time.

The Hidden Costs That Change the Calculation

Beyond the line items above, several costs consistently go untracked in in-house repair models:

  • Loaner fleet carrying costs. The longer repair turnaround takes, the larger the loaner fleet has to be. Loaner devices are purchased capital sitting in rotation instead of being a student's primary device. Shortening repair turnaround directly reduces the number of loaners a district needs to maintain.
  • Staff opportunity cost. Every hour an IT generalist spends on a cracked screen is an hour not spent on cybersecurity, infrastructure, or instructional technology support. For IT directors managing lean teams with broad mandates, that tradeoff compounds over time.
  • Administrative overhead. Tracking repair status, managing parts orders, and communicating with teachers about device timelines adds hours across multiple staff roles, none of which show up in a repair cost estimate.
  • Volume variability. Education Week has reported that half of district administrators now absorb device repair costs directly, a financial burden that grows harder to manage as pandemic relief funds expire and replacement cycles converge. At 8–12 percent annual damage rates across a large fleet, in-house capacity needs either steady headcount or a permanent backlog.

What Outsourced Repair Actually Costs

Outsourced repair costs are easier to model because they're explicit. You pay per repair, or you pay a flat annual rate through a protection plan.

Per-occurrence repair works well for districts with variable or unpredictable damage volume. You pay only for what you submit, there's no minimum commitment, and costs tie directly to actual repairs. Districts that build repair volume forecasting into their annual budget cycle using enrollment and historical damage data can budget for per-occurrence repair with reasonable accuracy.

Annual protection plans convert repair costs into a predictable per-device OpEx line item. For districts that need budget certainty, flat-rate pricing removes the variable cost problem entirely. iTurity's protection plans start at $9 per device per year, a figure that's straightforward to model against even partial in-house staffing costs.

What outsourced repair also delivers that in-house programs typically can't match at scale:

  • Faster turnaround through purpose-built repair infrastructure
  • Consistent quality from technicians trained specifically for high-volume device repair
  • No parts inventory to manage or capital to tie up in stock
  • No staff time diverted from higher-priority IT functions

Running the Comparison for Your District

There's no universal answer. A small district with a low-volume tech and a modest device fleet may find in-house repair cost-competitive. A district managing 3,000+ devices across multiple buildings almost always finds that outsourcing is the lower total-cost option once all variables are counted.

The comparison to make isn't repair cost per unit. It's total repair program cost versus total outsourced cost, including labor, parts, inventory, loaner fleet overhead, and the value of IT staff time redirected to repair queues. Framed that way, the economics shift considerably for most mid-to-large districts.

The Model That Works at Scale

For most K-12 districts running 1:1 programs at large scale, outsourced repair lowers total cost once labor, parts, and indirect costs are fully accounted for. The real question is which outsourced model fits your budget structure: per-occurrence flexibility or flat-rate predictability.

iTurity works with 4,400+ schools across 43 states. Whether your district needs per-occurrence repairs for flexible budgeting or a protection plan for cost certainty, the model is built to give IT directors accurate, predictable repair costs and fast turnaround, both of which reduce the hidden carrying costs that make in-house repair more expensive than it first appears.

How to Forecast K-12 Device Repair Volume by Enrollment

How to Forecast K-12 Device Repair Volume by Enrollment

Most districts approach device repair budgetingreactively: something breaks, it gets fixed, and the cost lands wherever it lands. That approach works...

Read More
Why Chromebook Charging Ports Fail So Often in Classrooms

Why Chromebook Charging Ports Fail So Often in Classrooms

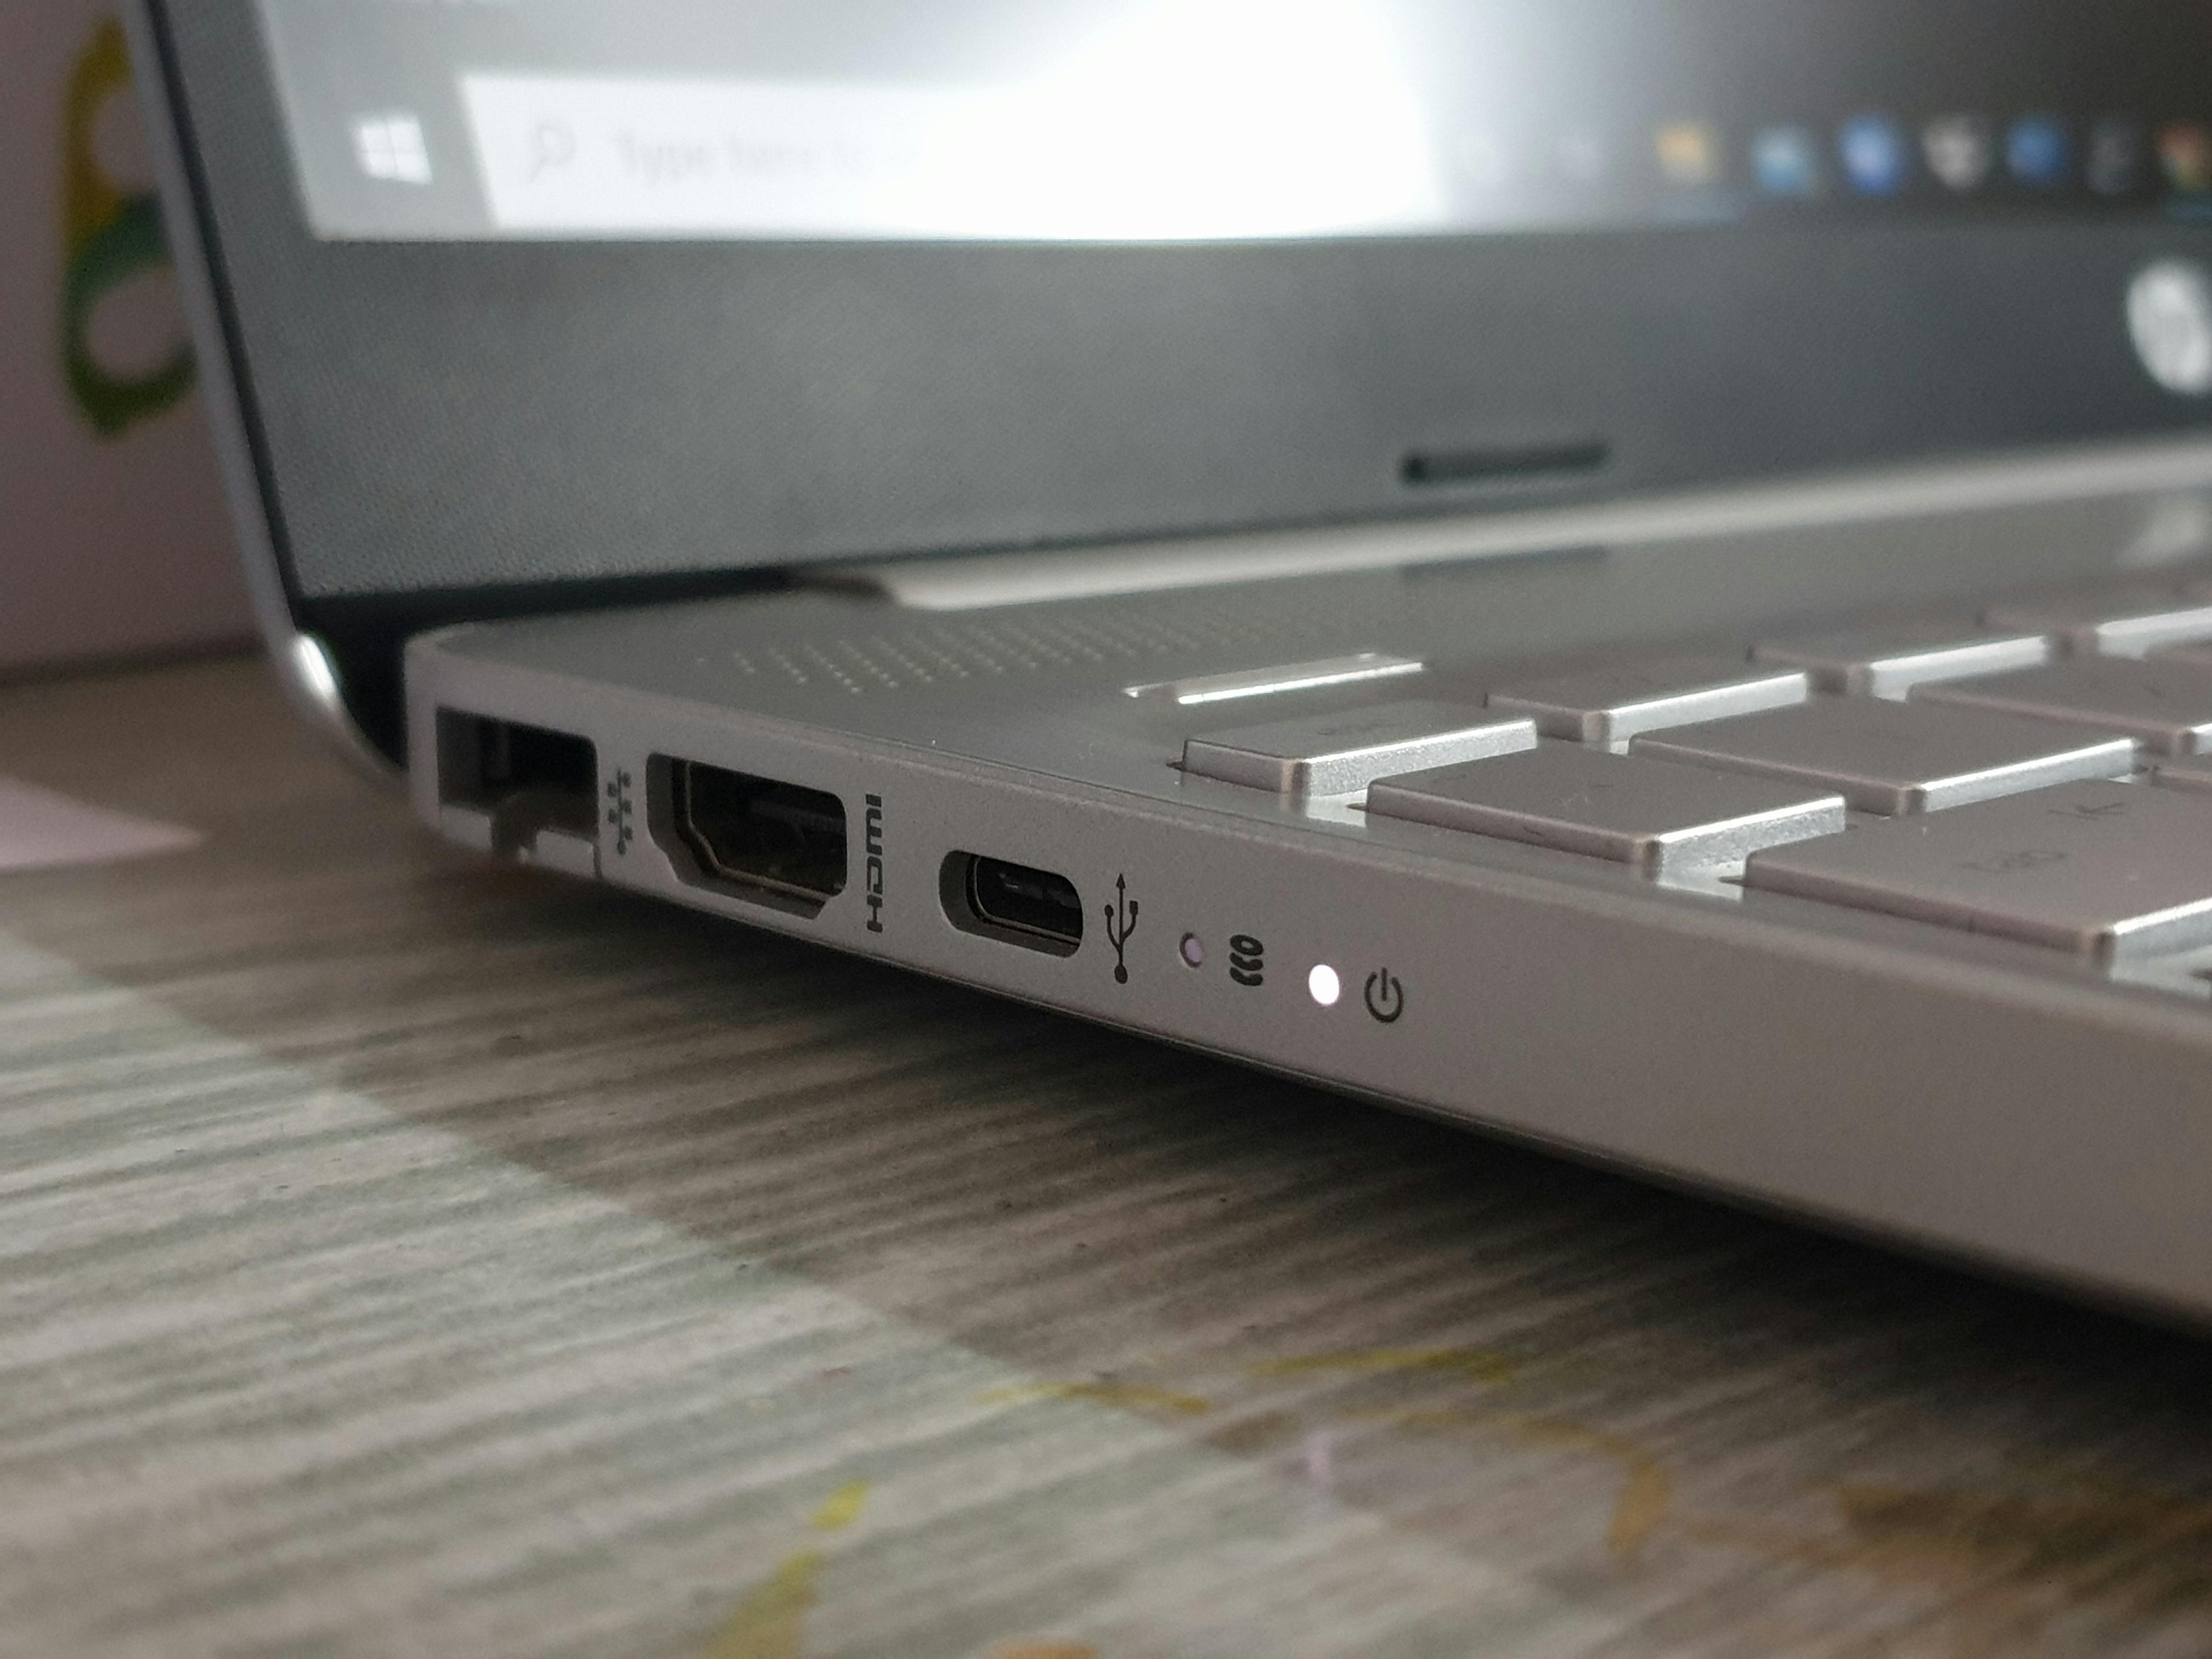
Ask any K-12 IT technician which repair they see most, and charging port damage will be somewhere near the top of the list. It's not a fluke. The...

Read More
Break-Fix vs. Yearly Protection Plans for K–12: How to Choose the Better Fit

Break-Fix vs. Yearly Protection Plans for K–12: How to Choose the Better Fit

The pattern tends to repeat itself: cracked screens pile up in October, keyboard failures hit in January, and devices need to be back in students'...

Read More